
Snapshot of Australia
National summary data
Source:abs.gov.au
The Census provides a snapshot of Australia. It tells the story of who we are and how we are changing. It provides a picture of the economic, social and cultural make-up of Australia. The 2021 Census took place on Tuesday 10 August 2021.
Population
Census population count by state and territory
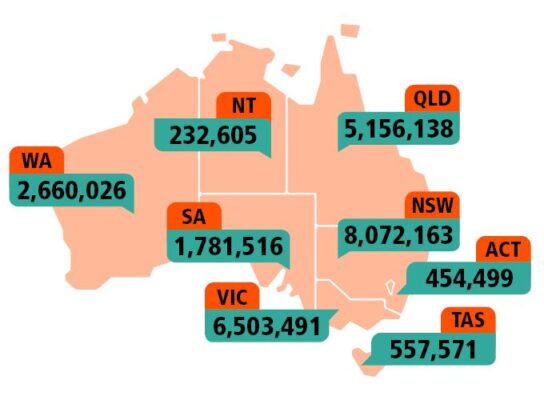
Note: Based on place of usual residence. Excludes overseas visitors and Other Territories.
The 2021 Census tells us about where we live:
- Almost 80 per cent of Australian residents live in eastern Australia in New South Wales, Victoria, Queensland and the Australian Capital Territory.
- NSW continues to be the largest state with over 8 million people, with Victoria not far behind with 6.5 million people.
- ACT had the fastest growth with a 14.4 per cent (57,102 people) increase since 2016.
- 66.9 per cent of people counted were in Greater Capital Cities and 33.1 per cent were in the rest of Australia.
- Greater Sydney remains the largest city in Australia with 5.2 million people, followed by Melbourne with 4.9 million people and Brisbane with 2.5 million people.
Living with COVID-19
On Census night, Tuesday 10 August 2021, many parts of the country were in lockdown or subject to border restrictions. The data has been reviewed with consideration of COVID-19 impacts.
International border restrictions were in place and the 2021 Census counted 61,860 overseas visitors, significantly less than the 315,531 in 2016.
We can see that lockdown and travel restrictions influenced where people completed the Census:
- Census household response rate increased from 95.1 per cent in 2016 to 96.1 per cent in 2021
- the percentage of households completing online increased to nearly four out of every five forms received (79 per cent)
- more families and households were together on Census night, and therefore together in the data
- 984,809 people completed their Census form while away from home
- the eastern states saw an increase of people at home, while the Northern Territory and Western Australia had an increase in visitors.
Age and sex
Our age
The median age of all Australians remains at 38 years in 2021. Males make up 49.3 per cent of the population with a median age of 37 years and females make up 50.7 per cent with a median age of 39 years.
Australia is undergoing a significant generational shift. Baby Boomers and Millennials each have over 5.4 million people, with only 5,662 more Baby Boomers than Millennials counted on 10 August 2021.
Census count by generation
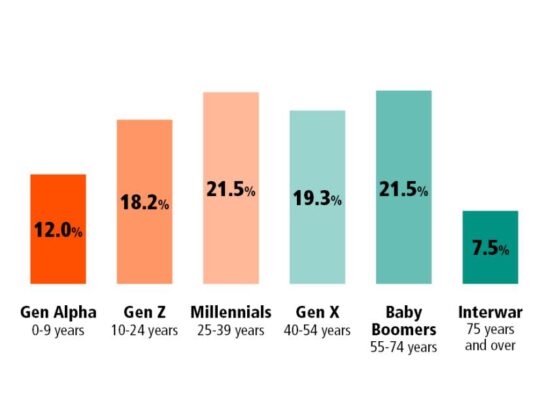
Note: Excludes overseas visitors.
- Millennials are of working age and are upskilling, representing 40 per cent of people attending vocational education, including TAFE, and 48 per cent of people currently serving in the regular service in the Australian Defence Force.
- Baby Boomers are providing care for other peoples’ children, often their grandchildren. Around one in eight (12.8 per cent) Baby Boomers reported caring for other peoples’ children, and of these, two thirds are female (67.5 per cent). They are also the generation most likely to volunteer and provide unpaid assistance to others.
- Generation Z (10-24 years old) represent 18 per cent of the Australian and 30 per cent of the Aboriginal and Torres Strait Islander population.
Aboriginal and Torres Strait Islander communities
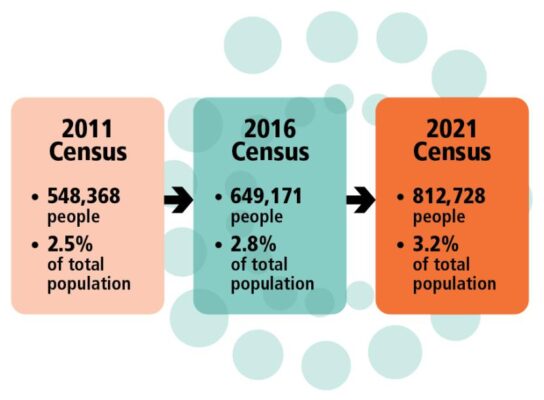
The Census found that 812,728 people identified as Aboriginal and/or Torres Strait Islander. This is an increase of over 25 per cent (25.2 per cent) since 2016, with Aboriginal and Torres Strait Islander people now representing 3.2 per cent of the Australian population.
Aboriginal and Torres Strait Islander peoples population count now
- Of the Aboriginal and Torres Strait Islander people counted: 91.4 per cent identified as Aboriginal; 4.2 per cent identified as Torres Strait Islander; 4.4 per cent identified as both Aboriginal and Torres Strait Islander.
- Two thirds (515,347) of the Aboriginal and Torres Strait Islander population live in New South Wales and Queensland.
- There were 167 Aboriginal and Torres Strait Islander languages used at home in 2021 by 76,978 Aboriginal and Torres Strait Islander peoples. The most widely reported language groups used were Arnhem Land and Daly River Region Languages (14.5 per cent) and Torres Strait Island Languages (12.0 per cent).
Culturally and linguistically diverse communities
The Census provides a snapshot of the diversity of cultures and languages that make up Australia.
Country of birth and ancestry
Australia has a rich mix of cultural backgrounds and heritage, with the number of people living in Australia who were born overseas continuing to increase.
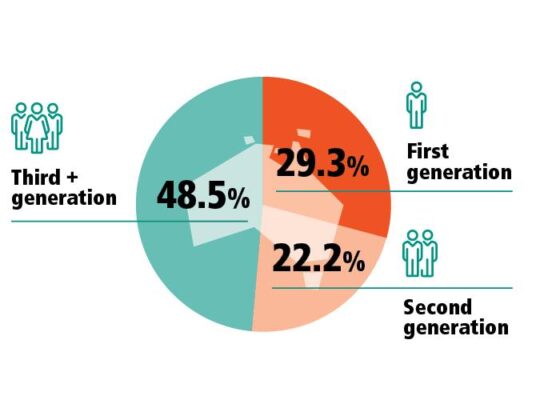
- The proportion of Australian residents that are born overseas (first generation) or have a parent born overseas (second generation) has moved above 50 per cent (51.5 per cent).
- The top five most commonly reported ancestries in the 2021 Census followed previous trends and included English at 33.0 per cent, Australian at 29.9 per cent, Irish at 9.5 per cent, Scottish at 8.6 per cent and Chinese at 5.5 per cent.
Note: Excludes overseas residents, visitors and responses not stated.
First generation refers to people living in Australia who were born overseas.
Second generation refers to people living in Australia who were Australian born with one or both parents born overseas.
Third+ generation refers to people living in Australia who were Australian born with both parents born in Australia.
Language and growth communities
Australia continues to be a culturally and linguistically diverse country with the growth of communities from Nepal, India, Pakistan, Iraq and the Philippines.
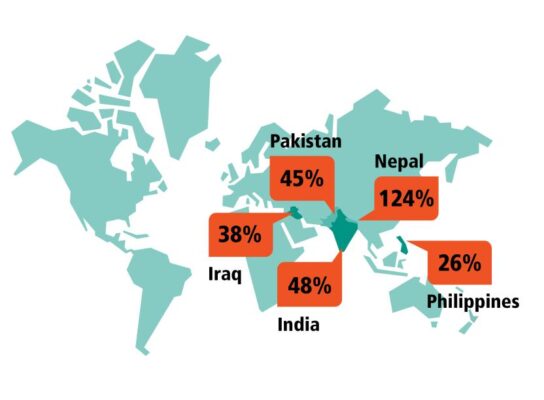
Note: Excludes overseas visitors. Refers to top five countries of birth where there was a growth of greater 20,000 persons between 2016 and 2021.
The use of languages at home reflects our changing communities:
- Mandarin continues to be the most common language other than English with 685,274 people using Mandarin at home.
- This is followed by Arabic (367,159 people), Vietnamese (320,758 people), and Cantonese (295,281 people).
- Punjabi had the largest increase, with the 2021 Census showing 239,033 people using Punjabi at home.
- Nepali featured in the top five languages used at home in both ACT (1.3 per cent) and Tasmania (1.3 per cent).
Religious affiliation
The diversity of religious affiliation has increased across the Australian population.
- The percentage of Australian’s reporting no religious affiliation continues to grow. It’s now at 38.9 per cent of the population compared to 30.1 per cent in the 2016 Census.
- Christianity remains the most common religion with 43.9 per cent of the population identifying as Christian, a decrease from 52.1 per cent in the 2016 Census.
- The top 5 religions outside of Christianity are Islam, Hinduism, Buddhism, Sikhism and Judaism.
- The religion question is voluntary in the Census, yet there was an increase in the proportion of people answering the question, from 91 per cent in 2016 to 93 per cent in 2021.
Our families and households
The 2021 Census counted more than 10.8 million private dwellings across Australia. The average number of people per household decreased from 2.6 in 2016 to 2.5 in 2021. Census reflects that Australian families come in many shapes and forms. The 2021 Census counted:
- 5.5 million (5,552,973) couple families, of which 53 per cent have children living with them (53.0 per cent) and 47 per cent do not have children living with them (47.0 per cent)
- 2.5 million (2,550,284) families with children under the age of 15 years
- there are more than a million one parent families (1,068,268). As a proportion of families this is increasing slowly, from under 15 per cent (14.5 per cent) in 1996 to nearly 16 per cent (15.9 per cent) in 2021.
Following the 2017 amendments to the Marriage Act 1961, which enabled marriage equality, nearly 25,000 same sex marriages (23,914) were counted in the 2021 Census.
Households
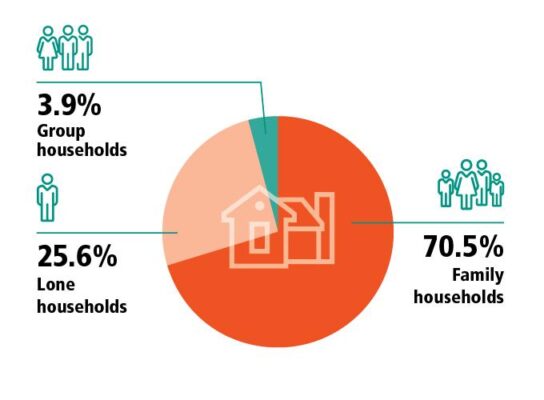
Note: Based on place of enumeration. Excludes visitor only and other non-classifiable households.
Australian homes
- 70 per cent were separate houses, 13 per cent were townhouses and 16 per cent were apartments.
- Two thirds of households (66.0 per cent) own their home outright or with a mortgage.
- One third of households rent (30.6 per cent).
Housing tenure
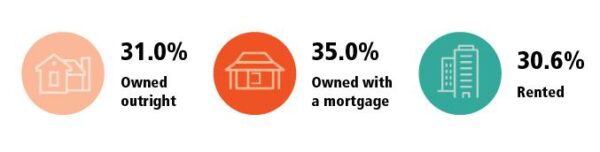
Note: Owned with a mortgage includes dwellings being purchased under a shared equity scheme. Rented excludes dwellings being occupied rent-free. Refers to occupied private dwellings and excludes visitor only and other non-classifiable households. Other tenure type and tenure type not stated represent remaining 3.4 per cent
Service in the Australian Defence Force
More than half a million Australians (581,139) have served, or are currently serving, in the Australian Defence Force.
- 84,865 people are currently serving in the Australian Defence Force.
- 496,276 people reported that they had previously served.
- One in twenty (5.3 per cent) Australian households (dwellings) had at least one person who had served or is serving in the Australian Defence Force.
- Females make up 20.6 per cent of currently serving members of the ADF, and 13.4 per cent of former serving members.
- The data shows that there are 129,437 former serving members between the age of 65-74 years.
Health of the population
For the first time, the Census collected information on ten common long-term health conditions in Australia. Over eight million people reported they had been diagnosed with a long-term health condition in the 2021 Census.
- 4.8 million people reported having one of the selected long-term health conditions
- 1.5 million had two of the selected long-term health conditions
- 750,000 people reported having been diagnosed with three or more of the selected long-term health conditions
- A further 1 million reported having at least one other long-term health condition
- More than 16 million people reported not having a long-term health condition.
The most commonly reported long-term health condition in Victoria, Queensland, Western Australia and the Australian Capital Territory was a mental health condition. In New South Wales, South Australia and Tasmania it was arthritis, and in the Northern Territory it was asthma.
For definitions of the terms used above, see the Census of Population and Housing: Census dictionary, 2021
For more information, please visit 2021 Census product release guide